
Have you used graphing in your interactive notebooks?
Step one: Cut out circles. I traced a can and then cut three different colors, but you could use more or less if desired.
Sometimes a circle is hard to cut out free hand, so I have created a template that makes it easier for the teacher and students.
Templates for Circle Graph and Other Foldable Graphic Organizers


Cut the radius of the circles as shown. Remember to stop in the center.
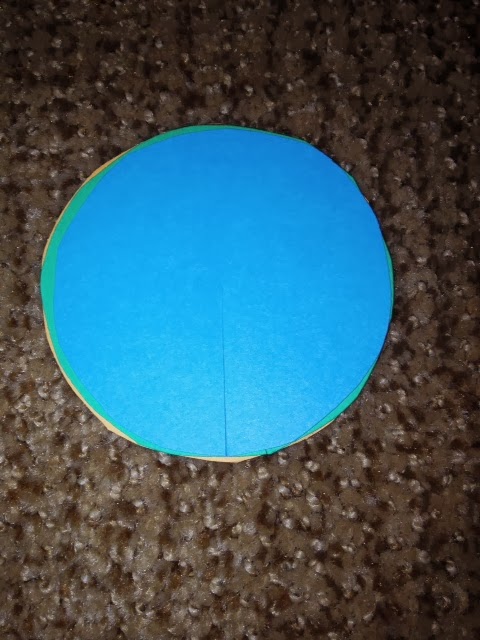
Interlock the circles using the slit created.


Add more colors as needed.

Below is an example in an interactive notebook.
Graphing is a great way for student to demonstrate understanding in their notebooks. This alternative to drawing their circle graph is engaging and meaningful to students. It can be adjusted to show the statistics that they are wanting to show. Collecting, analyzing, and recording data are all important process skills for science and social studies.

Templates
You can follow me by clicking the g+ button under my photograph or by clicking the follow by email button. You can follow me on twitter https://twitter.com/lywilliams132 or follow me on pinterest.
I appreciate your comments!
I also appreciate any sharing of this post on your social media!
You can follow me by clicking the g+ button under my photograph or by clicking the follow by email button. You can follow me on twitter https://twitter.com/lywilliams132 or follow me on pinterest.
I appreciate your comments!
I also appreciate any sharing of this post on your social media!